 WindMonitor
WindMonitor is my first useful internet application. It polls the Bureau of Meteorology's web site for wind and temperature observations from weather stations around the bay and graphs the data for the day. From my desk, I can monitor the current wind conditions and examine the trends for the day like, has the sea breeze kicked in yet?
System Requirements:
- Win95/98/NT/2000
- Internet access
Download
Running WindMonitor
The first time you run WindMonitor you will asked if you wish to create the the observations database. WindMonitor gathers and stores the weather observations in this database. Once this has been created, WindMonitor will gather the first set of observations. To graph something, WindMonitor needs two samples, so be patient until it has them. By default, no graphs are displayed. Use the Series button to add a new data series to the graph.
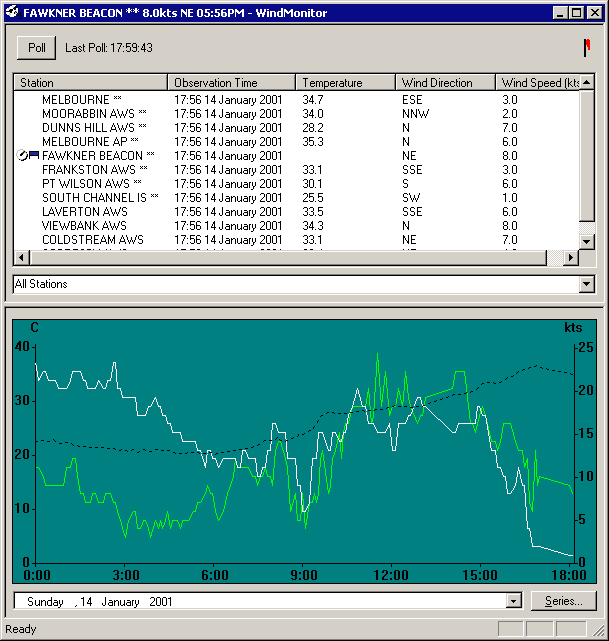
A typical session is shown below (a nice warm day with gusty northerlies). Click on the key objects to get help.

Title Bar
The title bar shows the application name and, optionally, the current observation from one station. This is selected by right clicking on the lists of current observations.
Poll Button
The poll button can be used to force the application query the internet for observation samples. Use this if you can't wait for the automatic polls.
Poll Status Flag
The poll status flag, ![]() , is an
animated indicator showing when the the application is queying the internet
for new samples.
, is an
animated indicator showing when the the application is queying the internet
for new samples.
Current Observations
The table in the top half of the window shows the current observations for all stations.
Selected Observation
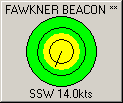
By right clicking on the Current Observation table, you can select and observation to display in the application's title bar, and in the Compass Window.
Observation Display Selection
By default, the current observation is displayed for each weather station, "All Stations". The selection box between the observations and the graph allow you to select all samples for one station.
Graph
The graph plots the wind speed, wind direction or temperature against time. What is displayed is configured using the series button. At least two samples are required to plot a line. Make sure the correct date is displayed.
Date Selection
The Date Selector at the bottom of the window allows the date to be specified. This allows viewing of previous days samples (if they are there)
Series
Click the series button to define which observations are to be graphed and how they are to be displayed. Nothing is displayed by default.
System Menu
The system menu, that in the top left corner, has two additional options: Purge and Options.
Purge
The purge option allows you to delete old samples from the database. There is no automatic purging of data. The database will continue to grow until you manually purge old data.
Options
Brings up the options dialog. This allows you to change the observations URL, poll frequency, column names and formatting.
Compass Window
 |
The compass window is a small window that remains on top of all other windows and shows a pointer indicating current wind strength and direction of a weather station. The line grows longer as the wind stengthens. The line colour changes to read when the wind gets over 15 knots (a good time to windsurfing I think) |